Cycling 80km in the Netherlands 🚴♂️
Data-driven exploration of my longest cycling ride yet
Show Table of Contents
Preface
I have been living in the Netherlands since September 2018. In the blink of an eye, I graduated, got my first job, switched careers, and in the midst of it, a whole pandemic occurred. Safe to say that these last 6.5 years felt like they flew by. When people think about the Netherlands, one of the first things that comes to mind is, you guessed it, bikes! According to the Netherlands Institute for Transport Policy Analysis (KiM), in 2022, there were an estimated 23.9 million1 bicycles, amounting to about 1.3 bicycles per person. That's a whole lot of bikes.
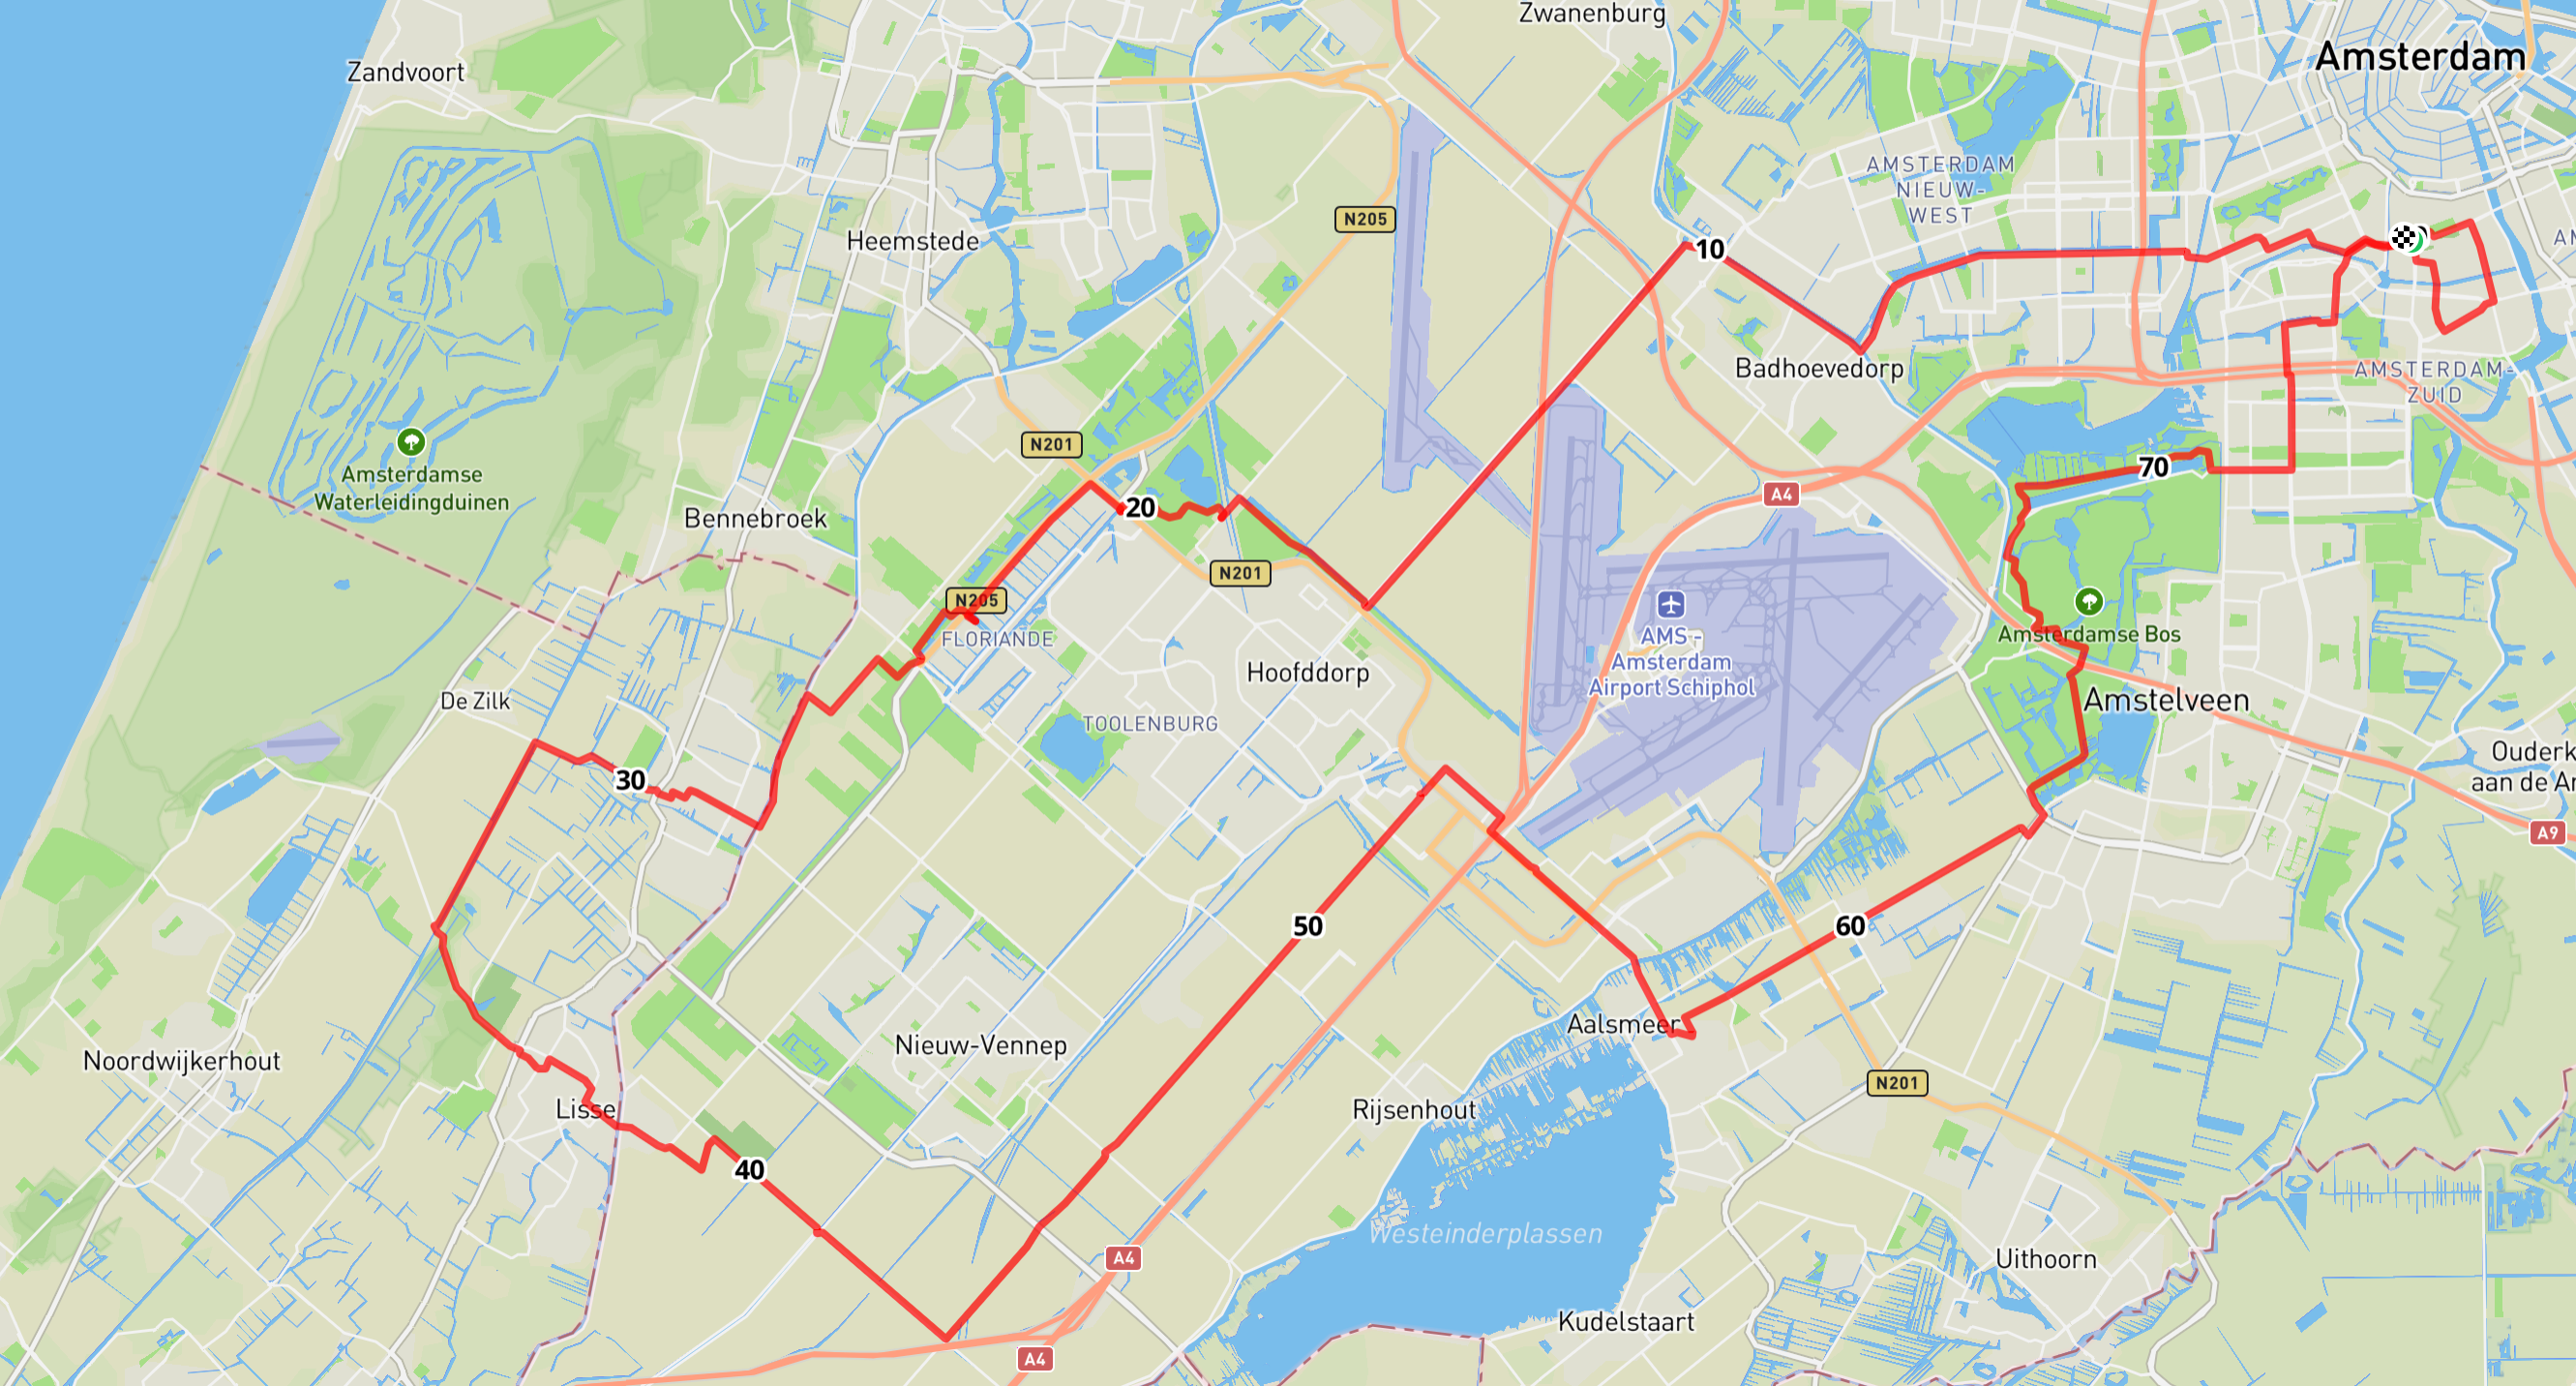
Personally, I enjoy cycling quite a bit. Not only because it's great for overall fitness, but also because of its effect on my mental health. Over nine months ago (May 9, 2024), I decided to go on a long distance cycling ride, partly motivated by the blooming flower fields, but also just because I enjoy it. I ended up cycling over a distance of 80km, starting at home, in Amsterdam, going around 35km South, to Lisse, a little town close to the famous flower fields of Keukenhof, and then all the way back home. In this blog post, I want to take you together with me on this ride and share some nerdy insights and moments.
Cycling route
As you would expect, the Netherlands has excellent cycling infrastructure with approximately 153,000km1 of cycle paths. So it's not difficult to imagine that you can pretty much get anywhere by bike in this country. I didn't have a very strict plan or route in mind, my sole goal was to bike a considerable distance and see the flower fields. Below you can find the whole trip with markers at every 10km.

Cycling route (May 9, 2024).
Statistics
Here are some basic statistics on speed (km/h) and elevation (m) for this trip.
| Metric | Value |
|---|---|
| Minimum speed | 0.01 |
| Maximum speed | 30.63 |
| Median speed | 18.2 |
| Mean speed | 16.91 |
| Minimum elevation | -5.02 |
| Maximum elevation | 6.34 |
Speed
If there's one thing I learned with this experience, it's that long distance cycling rides are tiring (who would have thought?). If you're a beginner, make sure to get some rest every other hour, bring plenty of water, a source of energy (e.g. protein bars), and be sure to also bring a power bank with you lest you get lost in the wilderness and can't find your way back.
My median speed was 18.2 km/h. For me, that was a maintainable speed for this type of long distance ride. I pushed it all the way up to 30.63 km/h at some point because I really wanted to know how fast I could bike with my 75€ rusty student bike (yep, still alive and kicking). It was fun, but it's not a bike that is really meant for this type of trip, more of a city bike.

Speed plot.
🗒️ Note: All plots have been averaged per minute, so you won't be able to see the entirety of the data, particularly isolated peaks. I'm using SVG2 files to display the data. There are 17081 data points for this ride. This significantly slows the rendering of the page. Thus, I averaged the data per minute, yielding a total of 289 data points.
Elevation
In terms of elevation, the ride was relatively flat, as expected in the Netherlands. The minimum elevation of -5.02m below sea level and the maximum elevation of 6.34m show that there were only minor changes in altitude, mainly due to bridges and viaducts. This made the ride less physically demanding and more enjoyable.

Elevation plot.
Distance
Lastly, let's take a look at the cumulative distance. It's interesting to see that, with the exception of the one longer pause I took close to the middle of the trip, the distance I rode with my bike was virtually linear. This is somewhat peculiar as I would have guessed that, with the passing hours, one would tire and the speed at which you would ride a bike would slowly decreasing, and this would be reflected in this plot, perhaps best represented by a logarithmic trendline.

Distance plot.
Outro
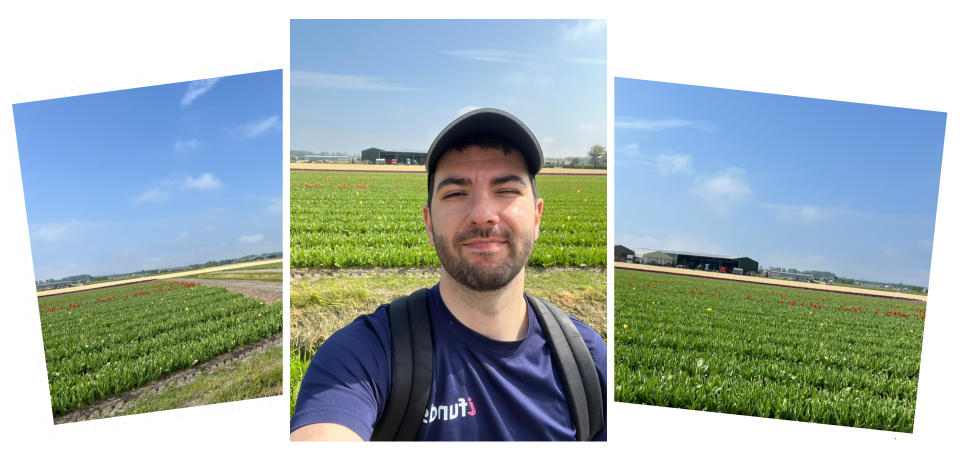
This was a great experience that I would highly recommend to anyone who enjoys cycling or is looking for a way to explore a less conventional way to uplift their spirits. The combination of physical activity, scenery, and the sense of accomplishment from completing such a long ride made it a memorable adventure. Whether you're a seasoned cyclist or a beginner, there's something rewarding about pushing your limits and discovering new places on two wheels. So, grab your bike, plan your route, and embark on your own cycling journey. Here are a few shots from my trip 😊
I'm planning to do another cycling trip this year once the weather clears up a bit, this time around I'm aiming for 100km! 🚴♂️

A few shots from my trip.
Footnotes
- Cycling facts 2023 ↩ ↩2
- Scalable Vector Graphics ↩