Releasing the stable production version of the ramachandraw Python package
Show Table of Contents
Preface
In late 2019, right before the start of the COVID-19 pandemic, I vaguely recall coming upon the idea of creating a Python package - for practice but also for fun. At that time, I was following a Master in Computer Science with a specialization in Bioinformatics at the University of Leiden (the Netherlands).
As is the case in many other fields, there is a plethora of tools written in Python available to the greater public through individual or communal efforts. In Bioinformatics, a very good example of a large Python package with broad usability is Biopython. In other words, we don't want to reinvent the wheel. Since this would be my first Python package, I would have to start small and be realistic about my expectations and goals. I spent some time devising what gap I could fill, or in which domain I could build something that would be truly useful and improve the productivity of the scientific community (or the greater public at large). I realized that there was no package available on PyPi1 that could draw a Ramachandran plot in a straightforward fashion, yet still allowing a highly-customizable setup, and providing relevant information (e.g. dictionary of φ and ψ torsion angles).
Ramachandran plot
Proteins are made up of aminoacid residues linked together in what we call a "polypeptide chain". There are two main torsion (dihedral) angles in this chain: Phi (φ) and Psi (ψ), defining the rotations of the polypeptide backbone around the bonds between N-Cα, and Cα-C, respectively2.

Phi (φ) and Psi (ψ) torsion angles. Source: Wikipedia.
Developed by G. N. Ramachandran et al. in 1963, the Ramachandran plot serves as a way to visualize energetically allowed (or favoured) regions for torsion angles φ against ψ. It can be used in two main ways:
- Assessment of protein structure quality: assess the accuracy/plausibility of protein structures by analyzing backbone torsion angles against allowed regions
- Secondary structure identification: identify secondary structure elements like α-helices and β-sheets by their characteristic patterns in the plot
Building a Python package
The first version of ramachandraw was released on PyPi a little over 4 years ago (December 2019). At that time, I used setup.py in combination with setuptools for the packaging and distribution of the project. I vaguely recall the whole process being rather clunky and unintuitive, but perhaps that was mostly due to my lack of experience.
Nowadays, we have a more modern approach to packaging in Python thanks to pyproject.toml (defined in PEP 518 and PEP 621). If present in a Python project, this file will be placed at the root of the directory structure. In a nutshell, pyproject.toml defines the project metadata and dependencies in a declarative manner. The concerns (e.g. tooling and project author(s)) are clearly separated, dependency management is also improved, and it integrates well with different tooling widely adopted by the community (e.g. poetry supports it).
Here's the pyproject.toml defined in ramachandraw-1.0.1:
[tool.poetry]
name = "ramachandraw"
version = "1.0.1"
description = "Ramachandran plotting tool"
authors = ["Alexandre Cirilo"]
license = "MIT"
readme = "README.md"

[tool.poetry.dependencies]
python = "^3.9"
matplotlib = "^3.8.3"
biopython = "^1.83"

[tool.poetry.group.dev.dependencies]
mypy = "^1.8.0"
pyclean = "^2.7.6"
pytest = "^8.0.1"
pytest-coverage = "^0.0"
ruff = "^0.2.2"
scipy = "^1.12.0"

[build-system]
build-backend = "poetry.core.masonry.api"
requires = ["poetry-core"]

[tool.ruff.lint]
select = ["I", "F401"]
ignore-init-module-imports = true
Since I used
poetry, some of the TOML sections are named differently (e.g.[tool.poetry]instead of[project]).
Using poetry
Declaring dependencies
One of the nicest features of using poetry in combination with the pyproject.toml file is that you can have so-called dependency groups. With dependency groups, you can categorize dependencies within a Python project based on their purpose. For example, with ramachandraw, there are a couple of tools that we only need in our virtual environment when developing - these will be defined in [tool.poetry.group.dev.dependencies]. The dependencies that are required for the Python project (part of the implicit main group) are defined in [tool.poetry.dependencies]. Say you want to add the ipython package when working on improving the project, you can simply run the following in your terminal:
poetry add ipython --group dev
📝 Reminder: The virtual environment needs to be activated.
Building the project
Once the project is ready to be built, poetry helps us once again with a very convenient one-liner:
poetry build
Running this command in the terminal will build the source and generate a wheel file in the dist directory (unless explicitly declared using --output (-o)).
Publishing the project to PyPi
Before publishing the Python package to PyPi, you should test it out using the rightly called Test PyPi. First, configure poetry to use the store token that can be generated using your (Test) PyPi account:
# Test PyPi
poetry config pypi-token.test-pypi pypi-YYYYYYYY

# Production PyPi
poetry config pypi-token.pypi pypi-XXXXXXXX
Then, simply publish to PyPi (after testing on Test PyPi):
# Test PyPi
poetry publish -r test-pypi

# Production PyPi
poetry publish
Unit testing
One very important aspect of software development that I omitted in the first versions (0.x.x) of ramachandraw is unit testing. Unit testing allows the testing of parts (i.e. units) of the code. With proper testing implemented, we can catch potential bugs early on, ensure that the changes we introduce comply with how we envisioned the software to work, and improve code maintainability.
For this project, I use the popular pytest testing framework. The tests are run automatically on every push to the master branch using GitHub actions. The coverage report (including the proportion of the codebase that is covered by tests) is uploaded to Coveralls.
Here's what running pytest and explicitly requesting the coverage statistics looks like:
❯ pytest --cov=ramachandraw
======================== test session starts ========================
platform darwin -- Python 3.10.13, pytest-8.0.2, pluggy-1.4.0
rootdir: /Users/alxdrcirilo/Documents/personal/ramachandraw
plugins: cov-4.1.0
collected 11 items

tests/test_fetch.py ......                                    [ 54%]
tests/test_get_phi_psi.py ...                                 [ 81%]
tests/test_plot.py ..                                         [100%]

--------- coverage: platform darwin, python 3.10.13-final-0 ----------
Name                         Stmts   Miss  Cover
------------------------------------------------
ramachandraw/__init__.py         0      0   100%
ramachandraw/exceptions.py       2      2     0%
ramachandraw/parser.py          32      0   100%
ramachandraw/utils.py           75      1    99%
------------------------------------------------
TOTAL                          109      3    97%


======================== 11 passed in 4.60s =========================
Using ramachandraw
As of ramachandraw-1.0.0, the package is only supported in Python 3.9-3.12. To install the package from PyPi using pip, simply run:
pip install ramachandraw
Or, if using poetry:
poetry add ramachandraw
The documentation can be found in the README.md file on the GitHub repository. All functions include docstrings which most modern IDEs3 support - these will help you remain efficient when developing and using ramachandraw without the need of checking the official documentation.
Example
Here's a simple example of fetching human deoxyhaemoglobin - 4hhb, from the wwPDB4:
from ramachandraw.utils import fetch_pdb

hemoglobin = fetch_pdb(pdb_id='4hhb')
To extract the φ and ψ torsion angles, use the get_phi_psi function:
from ramachandraw.parser import get_phi_psi

phi_psi(pdb_filepath=hemoglobin)
Lastly, to draw the Ramachandran plot, run the plot function:
from ramachandraw.utils import plot

plot(pdb_filepath=hemoglobin)
The ramachandraw Python pacakge supports plotting single PDB files or batches of multiple PDB files. Simply provide a list or tuple of PDB ids instead of a single str.
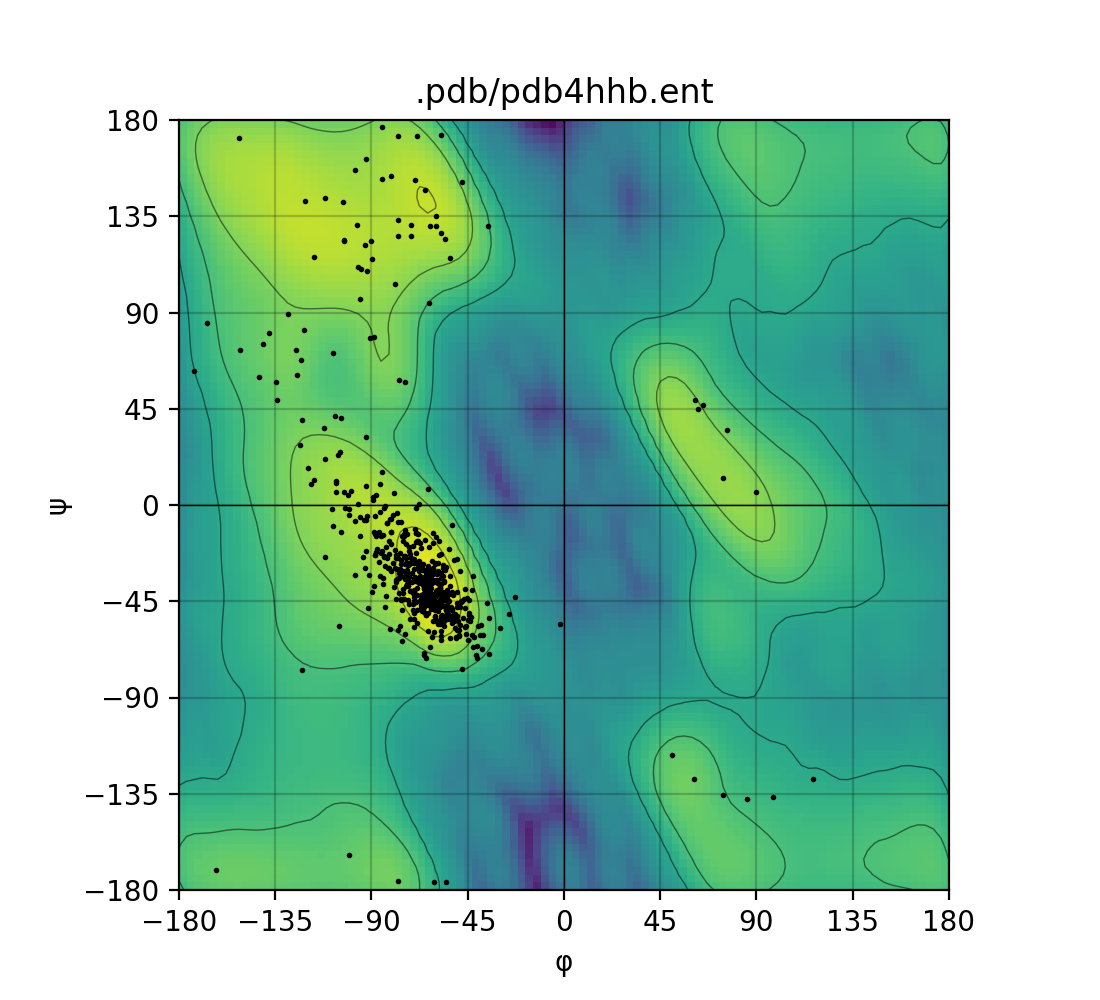
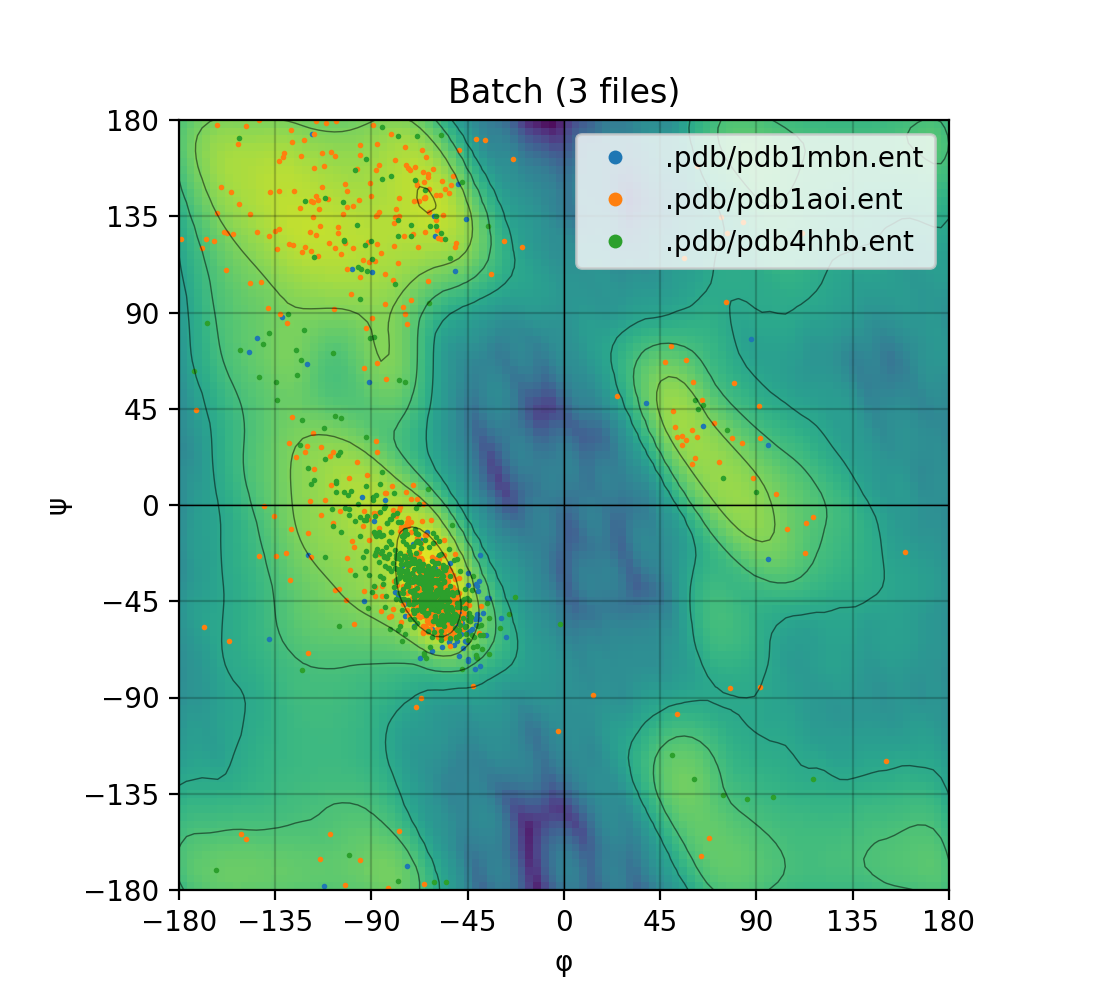
Ramachandran plot for one PDB and for a batch of PDBs, from left to right.
Footnotes
- Python Package Index ↩
- Torsion Angles and the Ramachandran Plot ↩
- Integrated Development Environment ↩
- Worldwide Protein Data Bank ↩